See Every Station. Manage Every User. From One Dashboard.
The Bikeep Console is the command center for your entire parking network. Bikeep hardware, firmware, claud, and the user app

One Dashboard for Your Entire Network
Purpose-built for parking infrastructure — not adapted from generic IoT tools
Know the Status of Every Station, Right Now
Live occupancy data, color-coded hardware health (Healthy, Unhealthy, Dead), voltage alerts, and WiFi signal tracking — all on one screen. The heartbeat system checks every station every 5 minutes and flags issues before your users notice them. Push firmware updates over the air without dispatching a technician.
Built on One Connected Platform
Console, App, and IoT Core — designed together, not stitched together. That means faster issue resolution, richer data, and zero integration gaps.
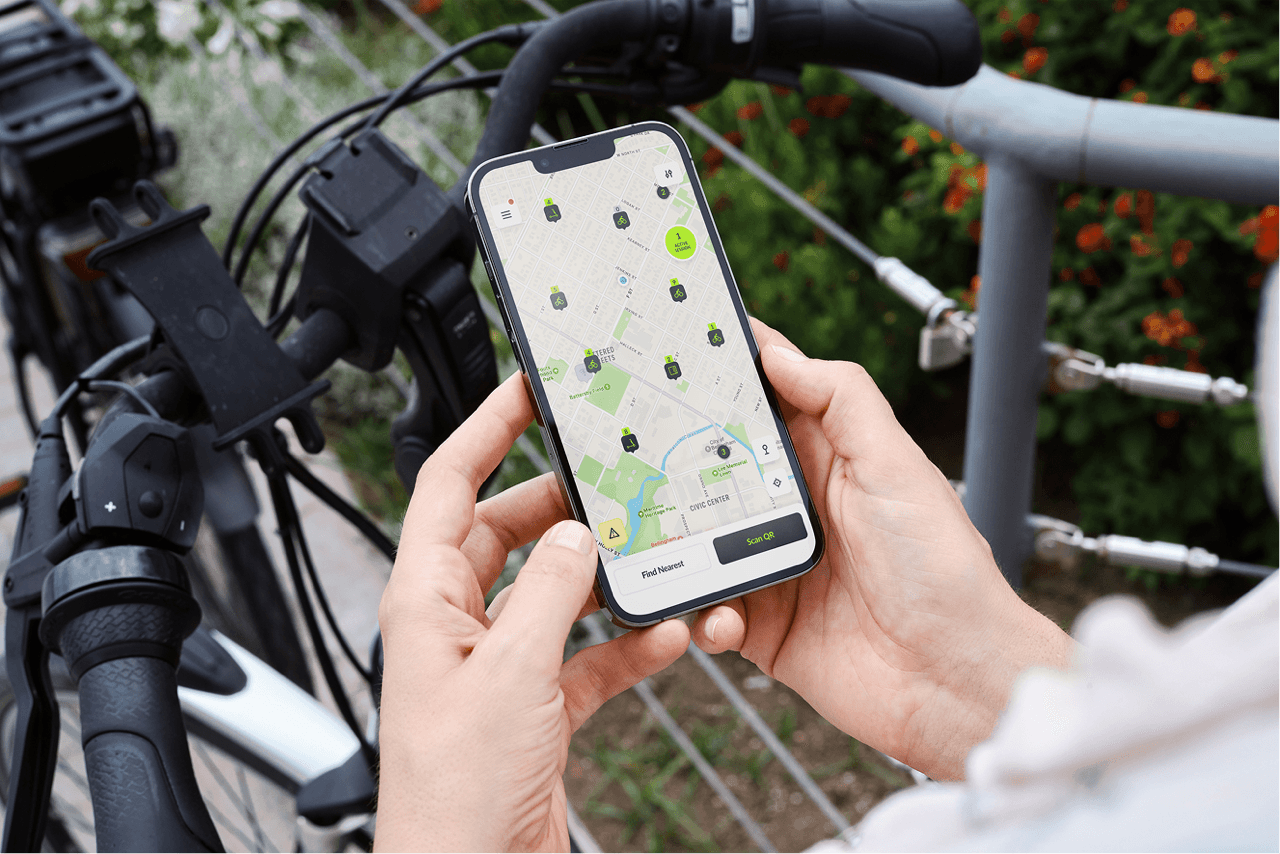 User Layer
Connected to the Bikeep App
End users interact through the app — parking, unlocking, reporting problems, requesting new stations. Every action feeds directly into the Console in real time. No middleware, no data lag.
 Data Layer
Powered by Bikeep IoT Core
The Console reads hardware telemetry directly — voltage, connectivity, lock state, firmware version. Because Bikeep builds the firmware, the dashboard shows data no third-party tool can access.
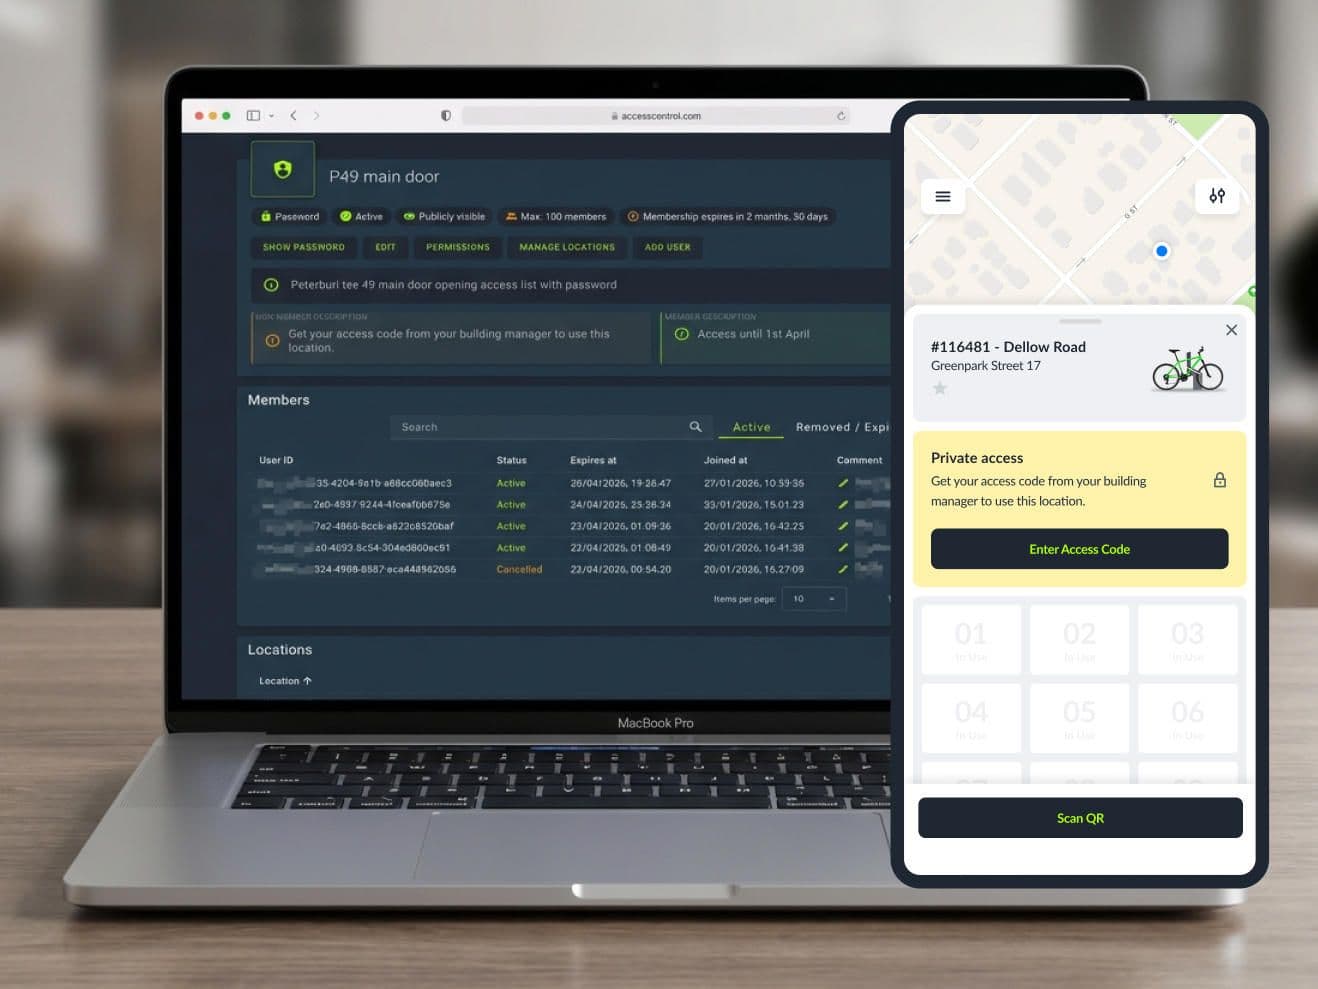
 Control Layer
Controls Every Station Remotely
Remote lock and unlock, OTA firmware updates, access rule changes — all executed from the Console and delivered to hardware instantly. One team built it all, so one dashboard controls it all.
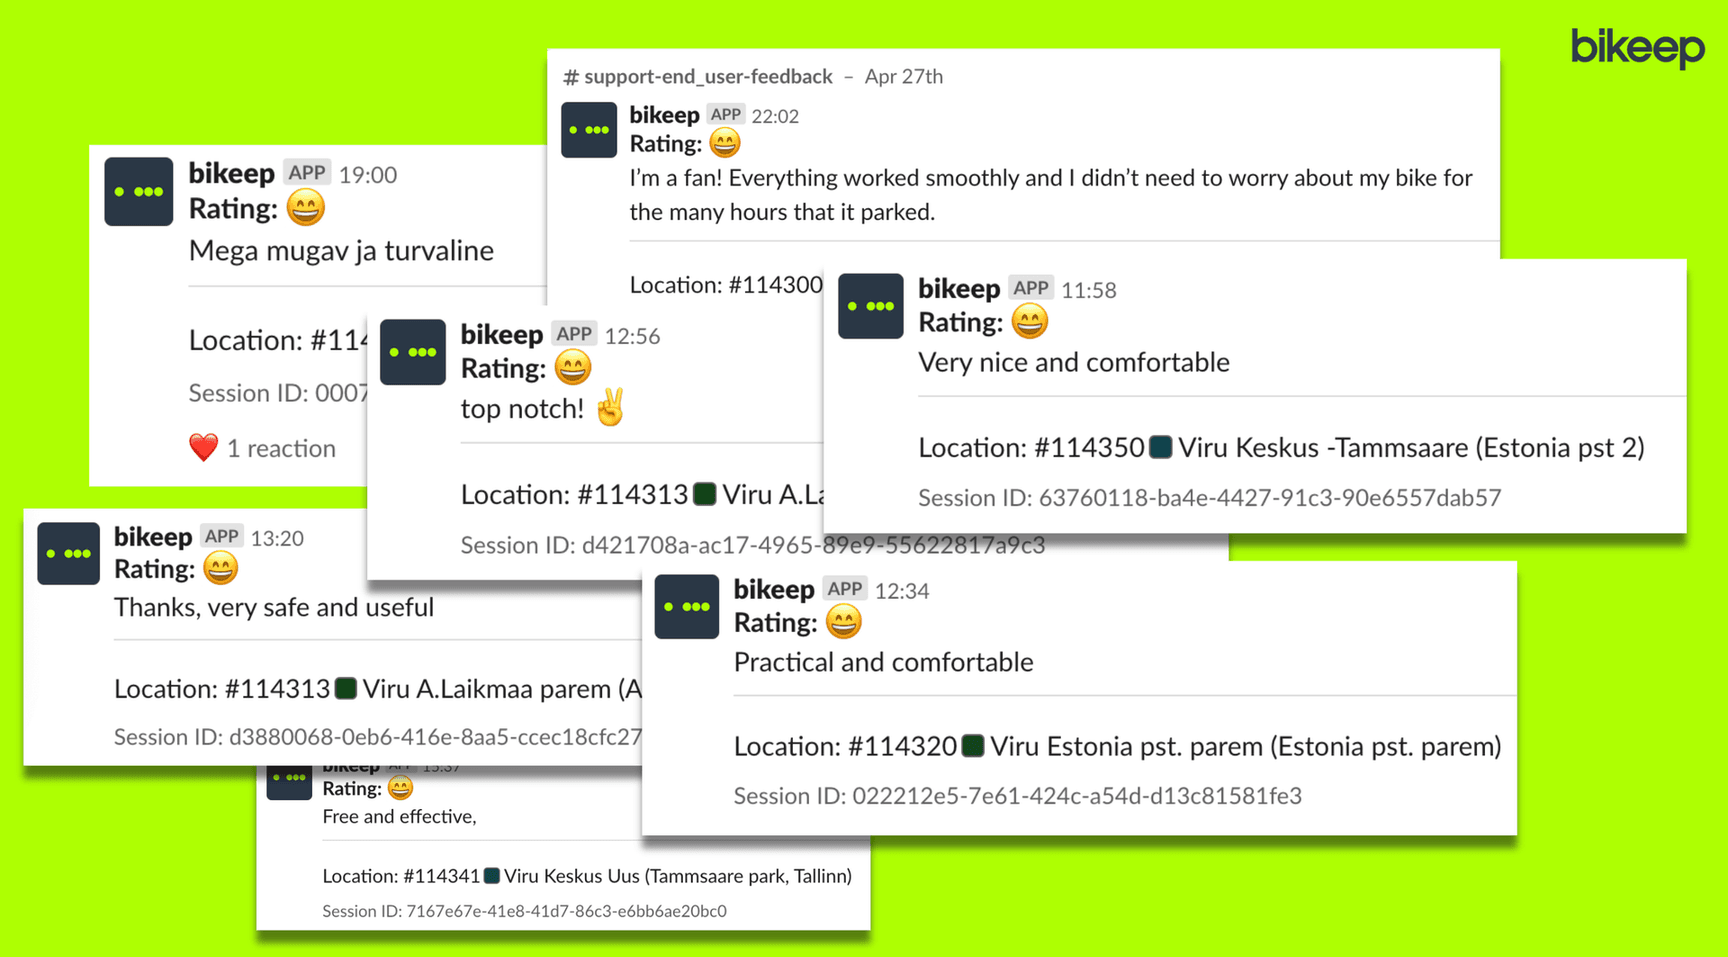
Your Users Are Your Best Maintenance Sensors
Most parking systems are blind to user experience. Bikeep closes the loop: cyclists report problems with photos directly in the app, and operators see feedback instantly in the Console. No phone calls, no email chains — just actionable reports with images.
Built for Every Stakeholder
Four perspectives, four workflows — all from the same Console
Set Up and Deploy Stations
Configure docking groups, assign locations, set pricing rules, and push firmware — all remotely. Add new stations to the network in hours, not weeks.
Monitor and Respond in Real Time
Live health dashboards, voltage alerts, and user feedback arrive as they happen. Triage issues, create maintenance tasks, and track resolution from one screen.
Support Clients with Data
Share live analytics dashboards with your clients. Generate usage, uptime, and revenue reports on demand. Prove ROI without spreadsheets.